Creating huge metabolic overviews for comparative genomics
I love looking at KEGG maps and using them to understand an organisms metabolism but they have their limitations. For starters, you’re obviously stuck with how they are drawn, which in most cases includes many variations on a particular pathway. Secondly, the tools for mapping on your own genes to a pathway are limited to one organism at a time. What I really wanted was a way of quickly comparing 10s of genomes across a common set of pathways, in this case amino acid synthesis pathways. Failing to find a suitable way to map on many genomes to KEGGs pathway images, I decided to roll my own. I mixed up manually drawing the pathways and then using code to color in the presence/absence of the reaction in each organism. My solution starts by creating a template svg image in Illustrator. This is the laborious part as I went through and redrew the amino acid pathways using information from both KEGG and MetaCyc. For each enzyme I positioned a grid of boxes, where each box represents an individual genome, that I would eventually color in based on the presence/absence of that reaction in that organism.
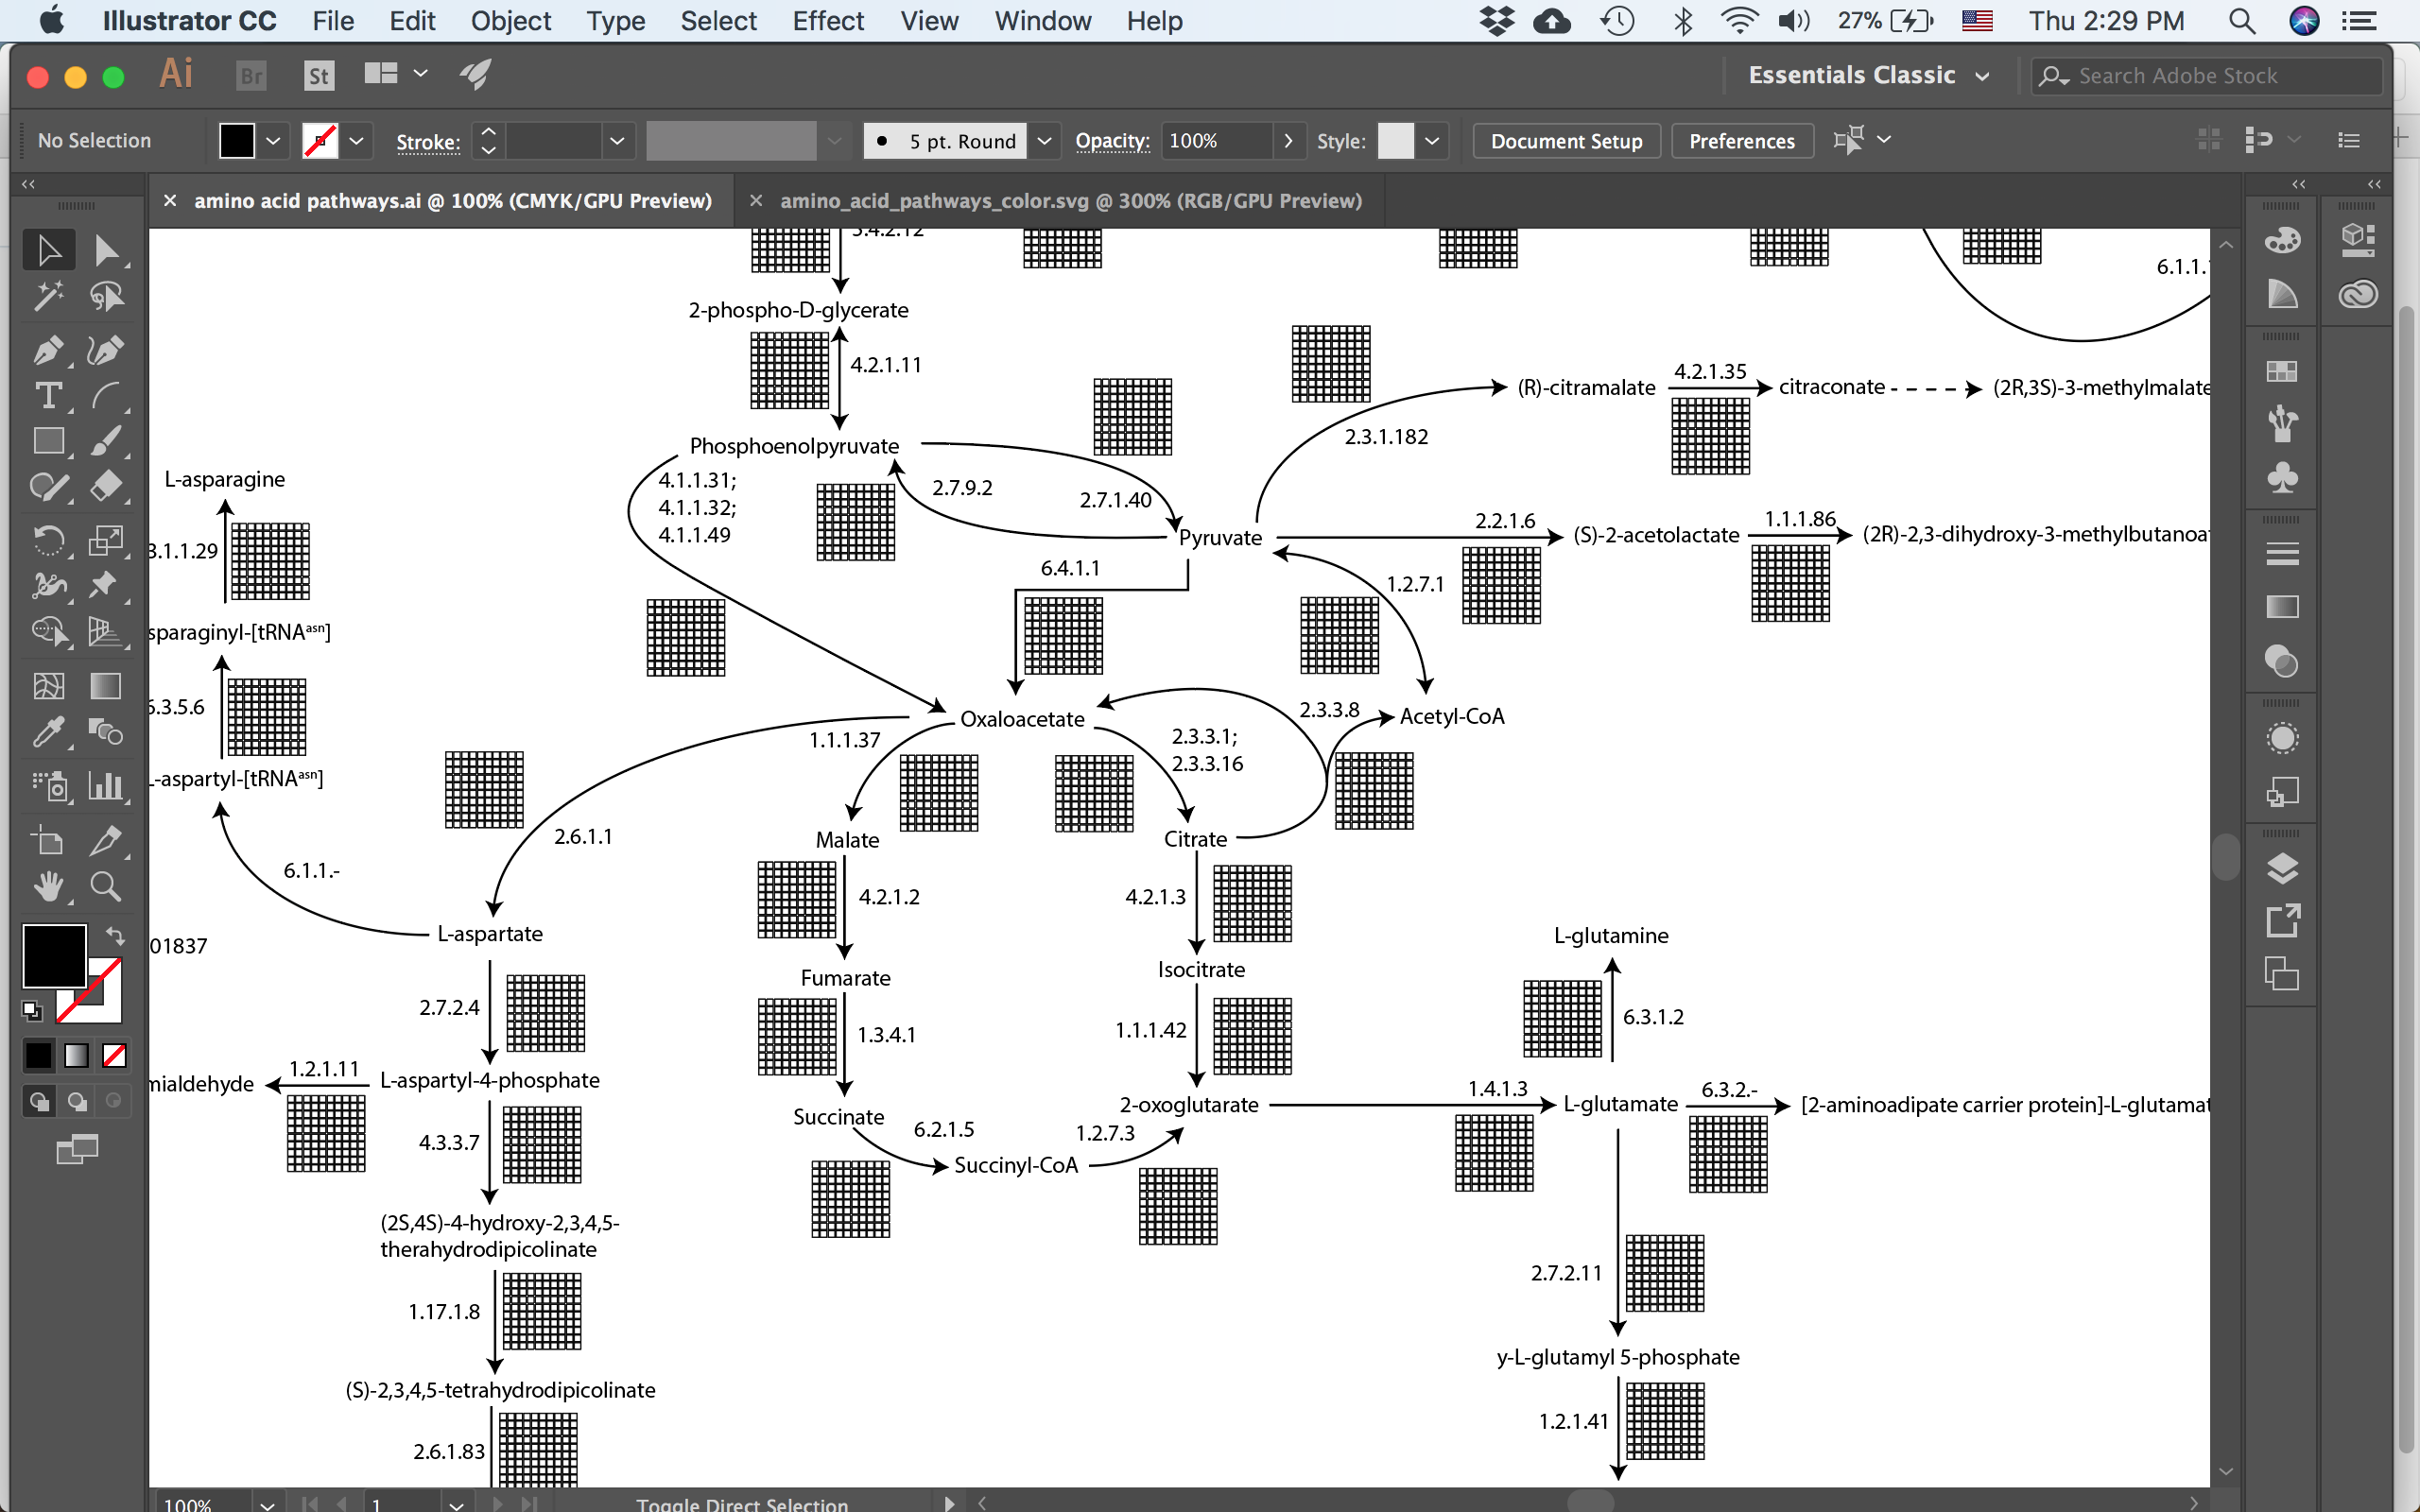
The TCA cycle and parts of the amino acid synthesis pathways. Each reaction is labelled with the EC number and contains a grid of 100 boxes.
Now the trick is to group the parts of the enzyme together and give that group a name in Illustrator. First the grid of 100 boxes was grouped first per row and then I grouped those 10 rows together (this is important and I’ll explain why below). And then the boxes, the arrow and the text label all got grouped together. Next name both the larger group and the boxes in Illustrator. You can do this easily by double clicking the group to enter “isolation mode”, where everything that isn’t in the group gets faded, and then changing the name in the layers panel of Illustrator.
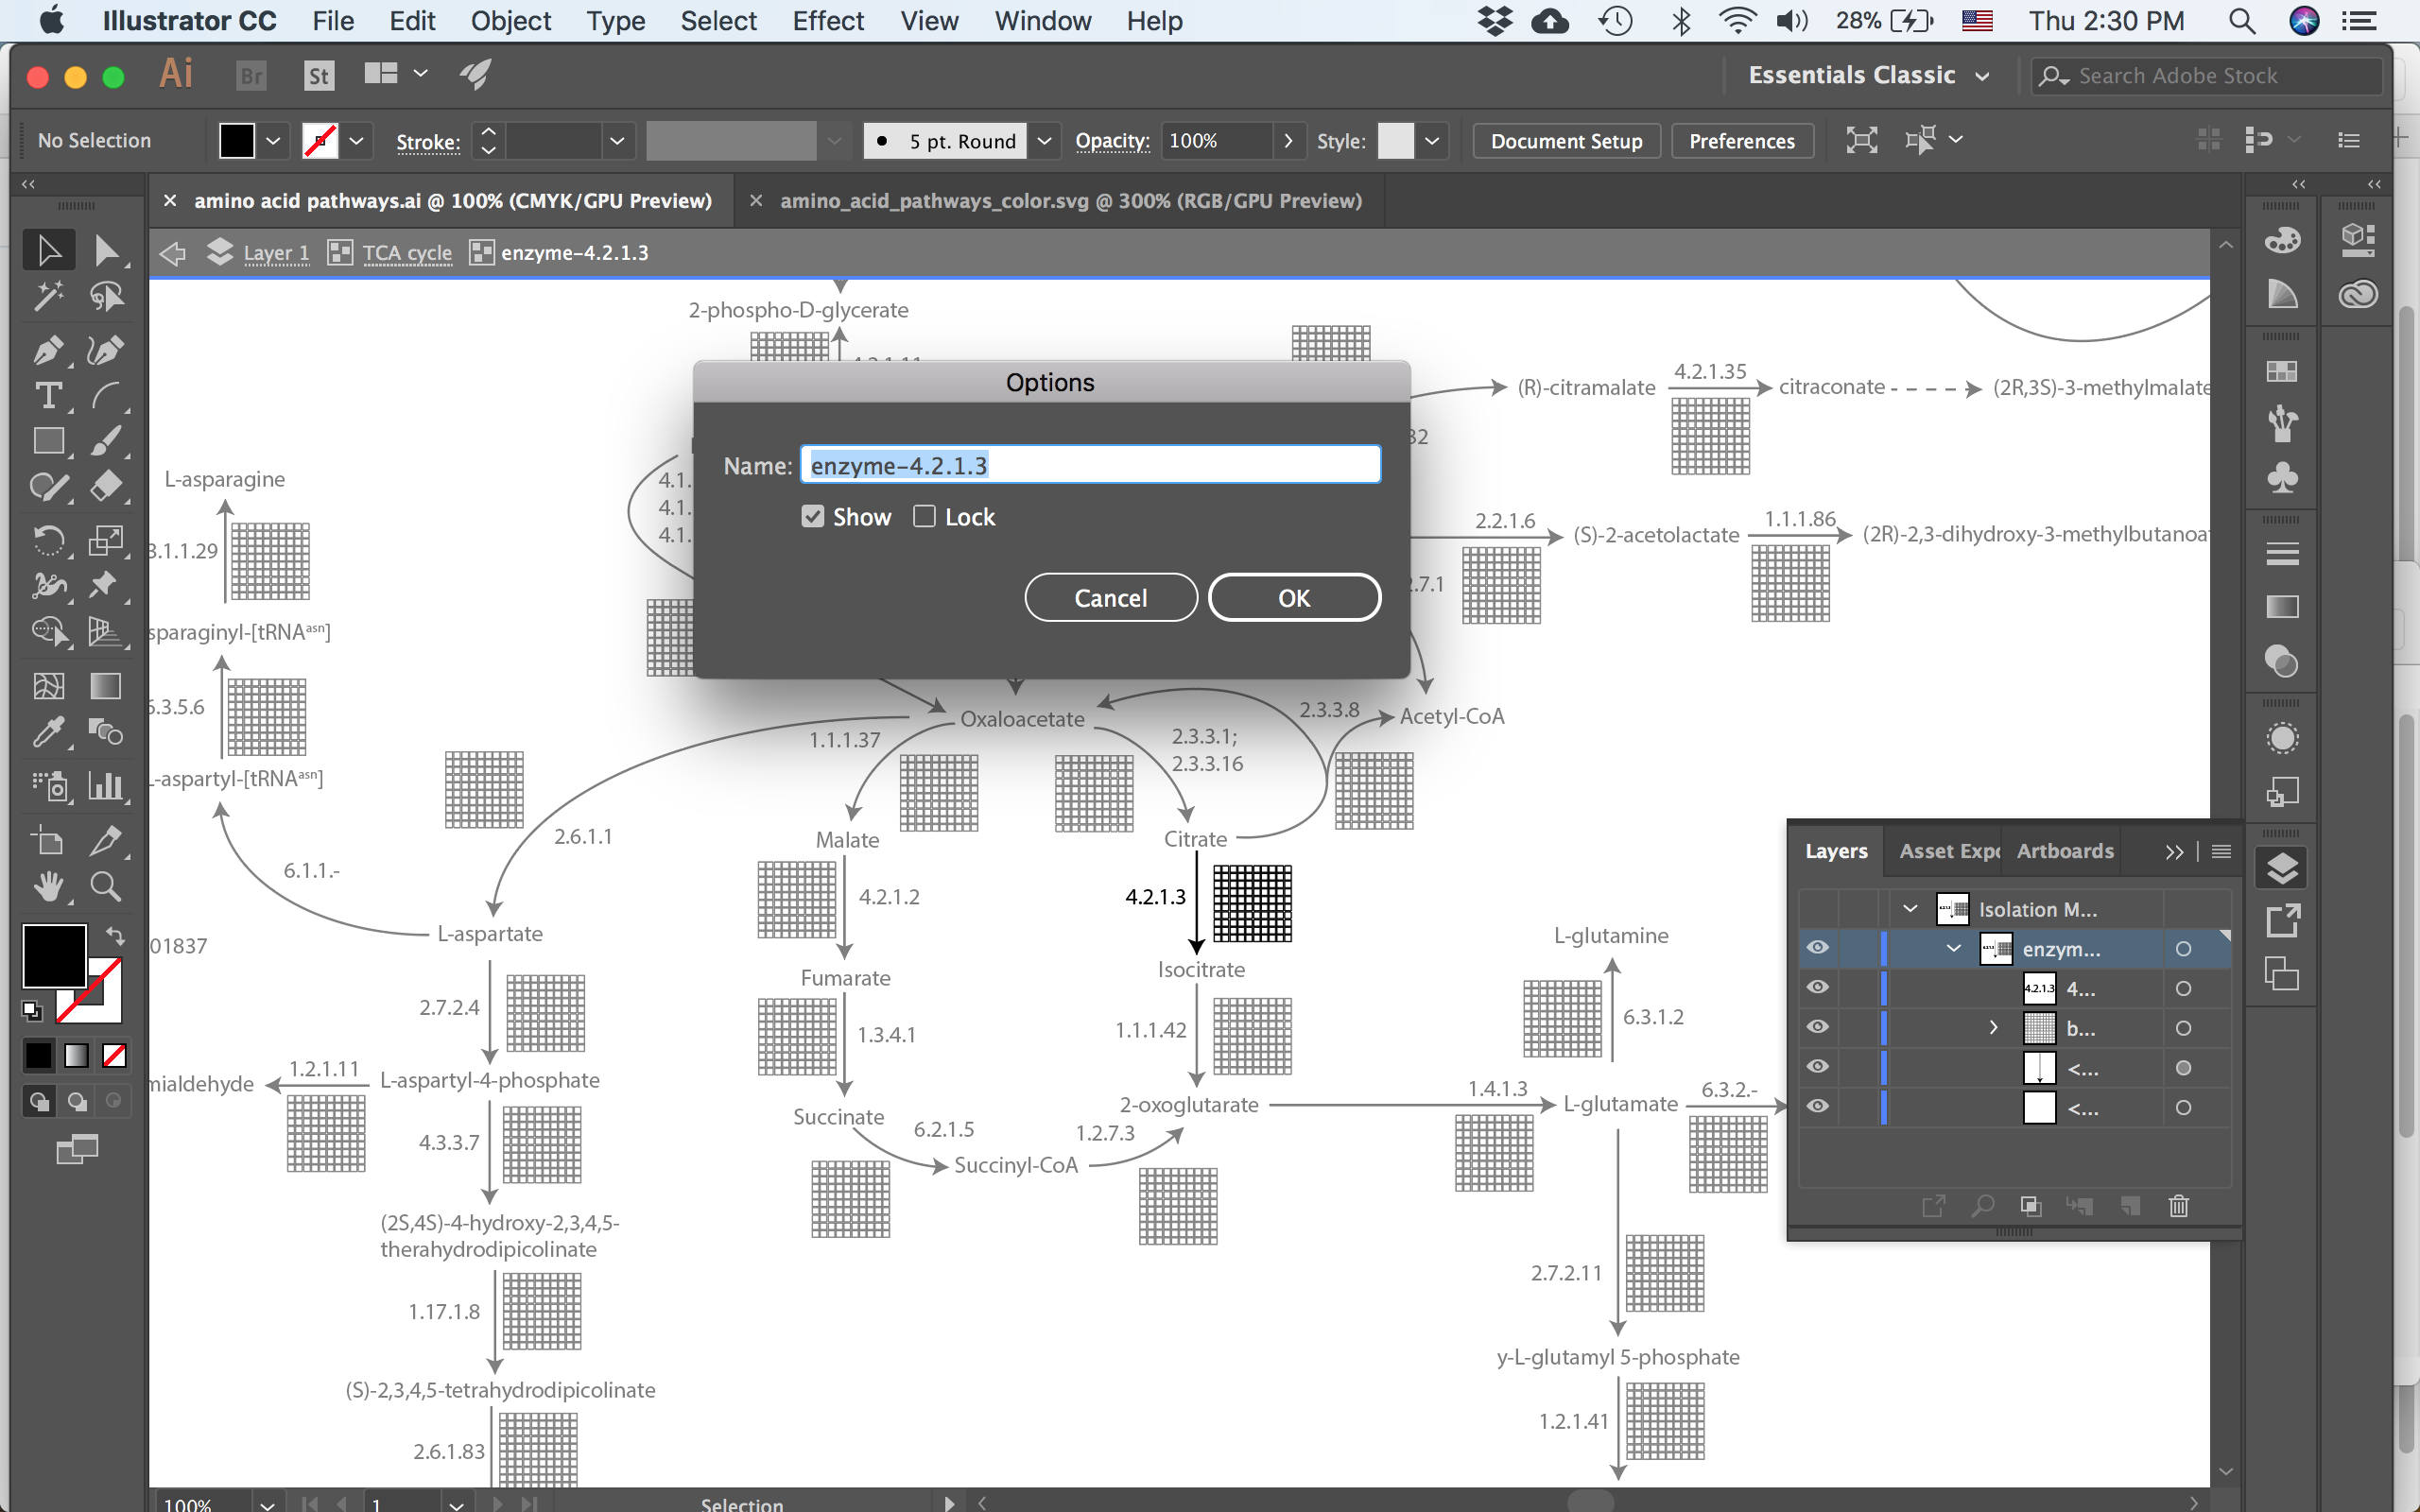
When in isolation mode, the layers panel gives easy access to changing the name of the group. In this case I’m calling the group after the EC number.
Now comes the critical part in naming - the group containing only the 100 boxes must be start with “box-” and then what follows will be the identifier that gets used for coloring the boxes.
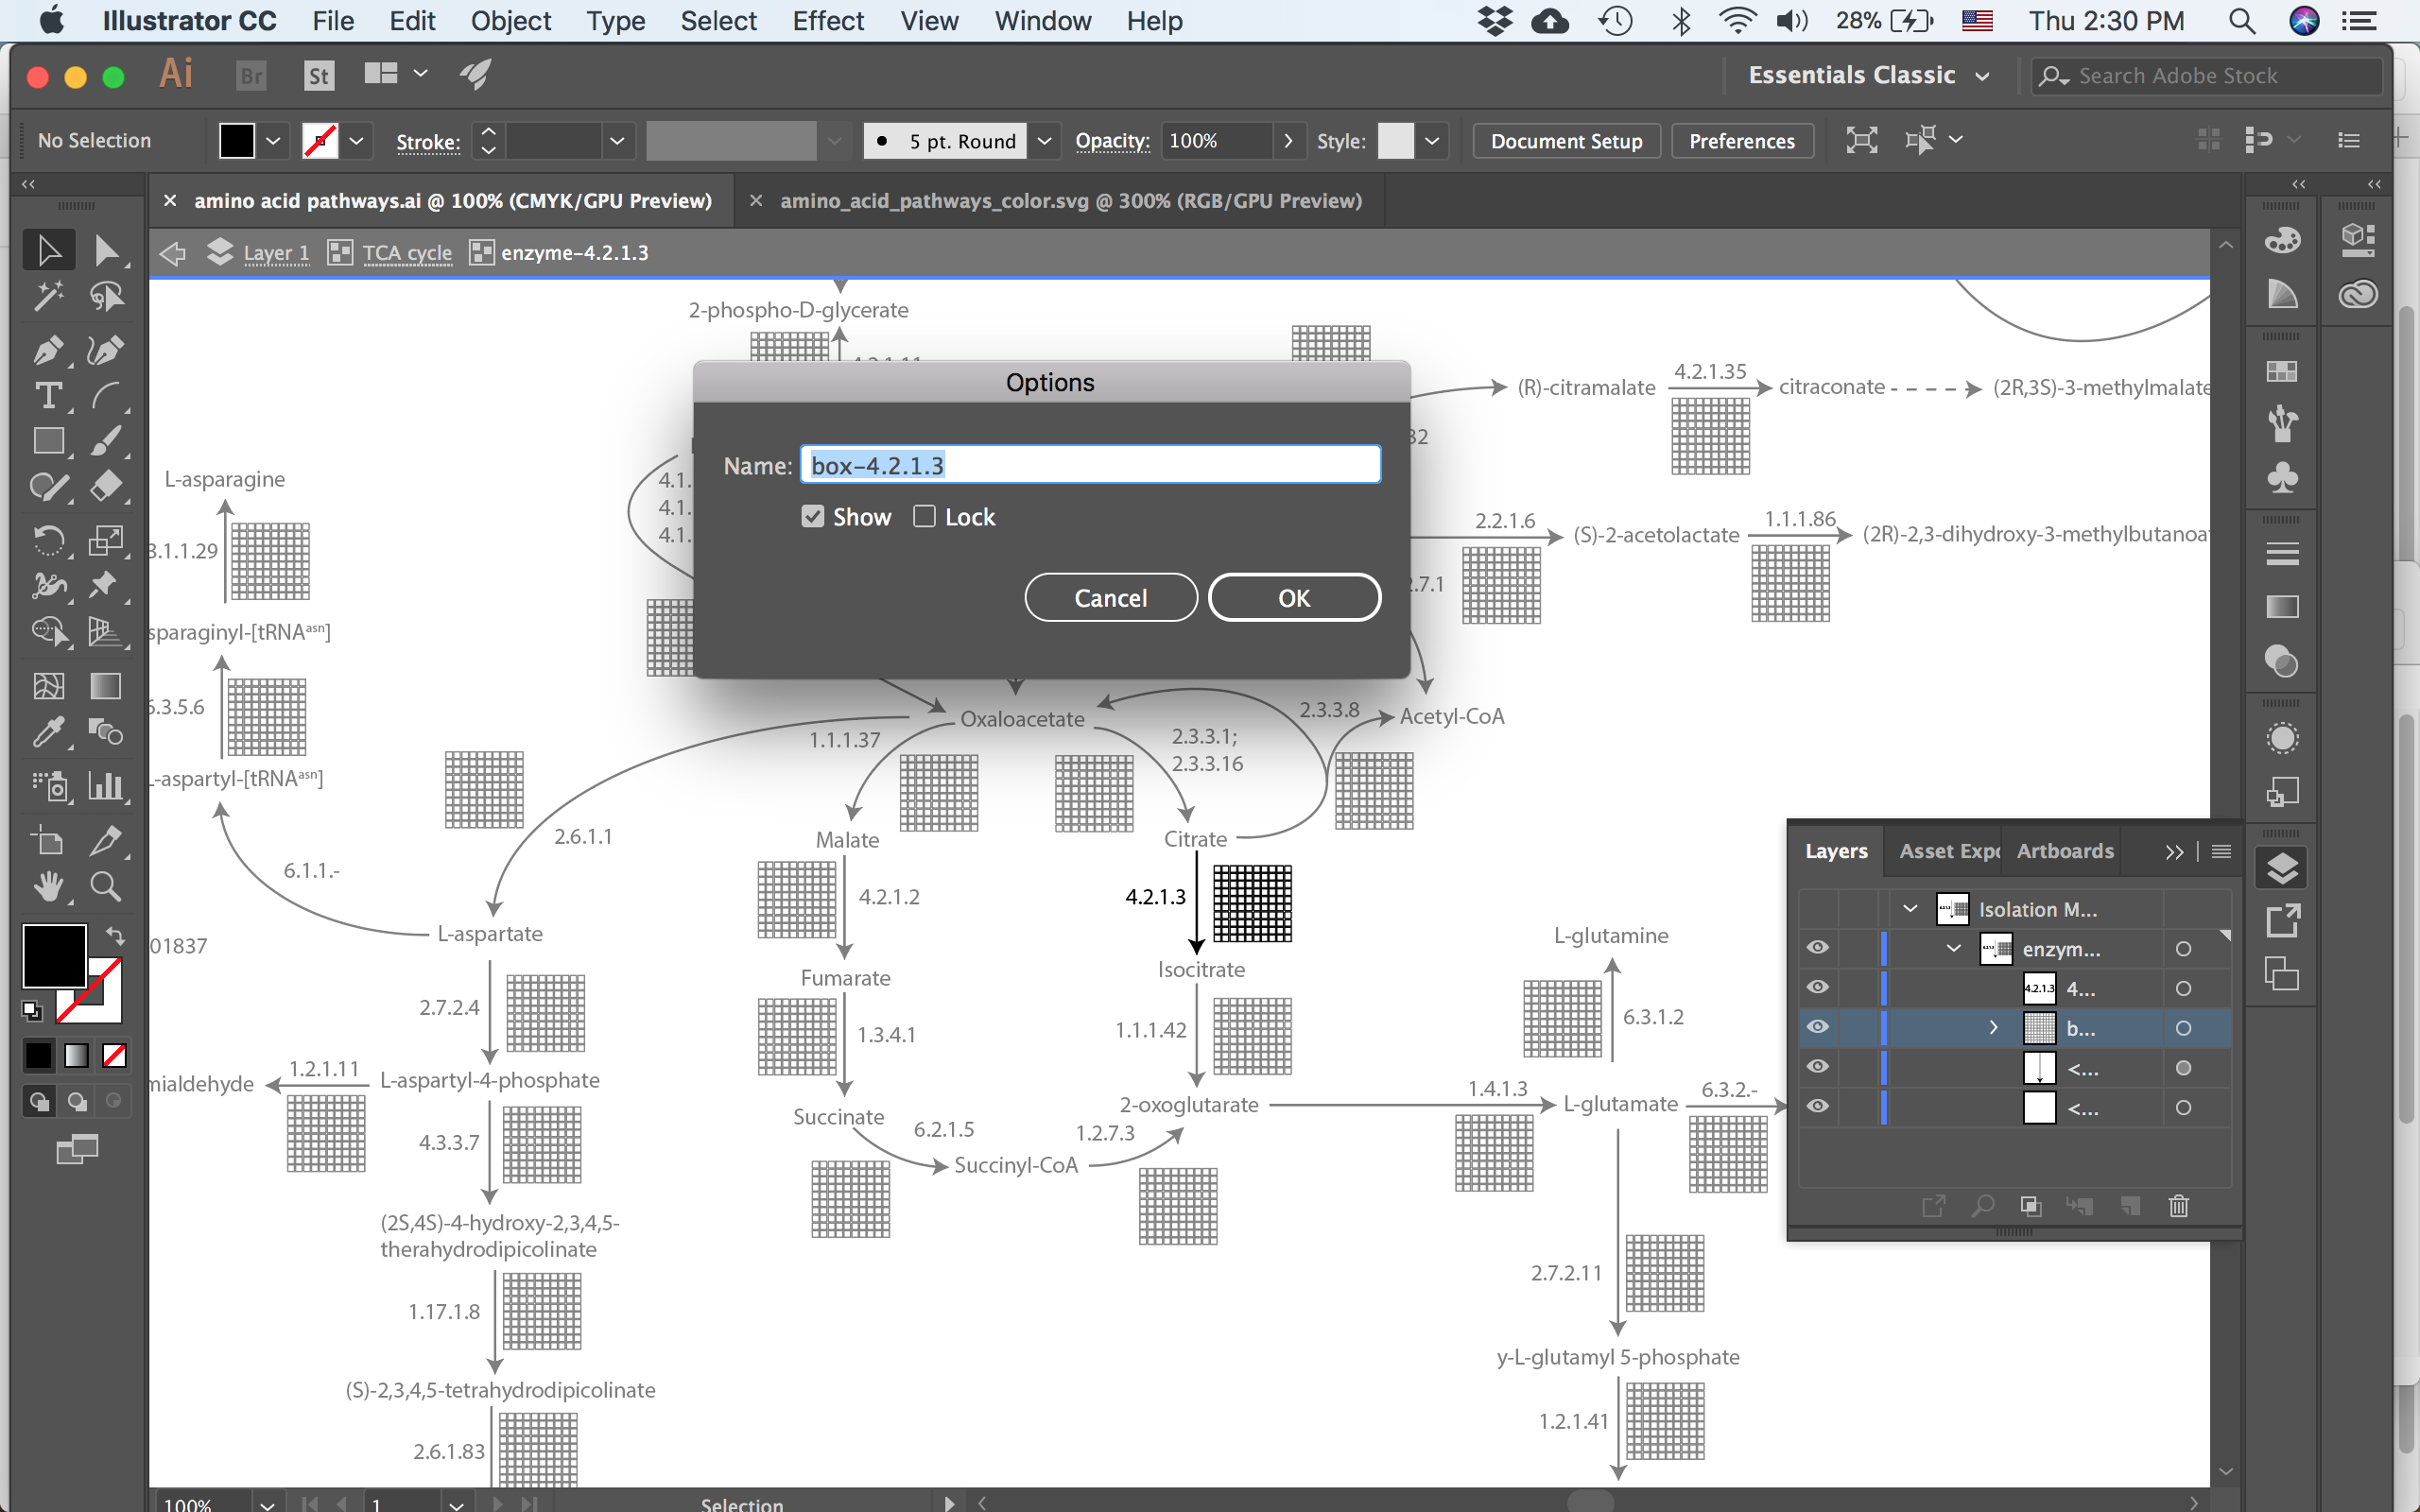
each enzyme has a sub-group containing the matrix of 100 boxes. This group must start with ‘box-’ and then whatever follows will be used to lookup that reaction for each organism.
In the case above I’m using the EC number again as my identifier. It is whatever is written after the “box-” in the name of the group that is important. This means that you could use any kind of label in the figure, for simplicity I’ve simply kept both the visual label of the enzyme and the name of the group to both use the EC number. Now, the reason why this is important is that we are going to save our figure as an svg file. Svg is an xml based file format, which means that it is simply text and thus is easy to modify using some scripting. Lets have a look at how each enzyme gets encoded in svg:
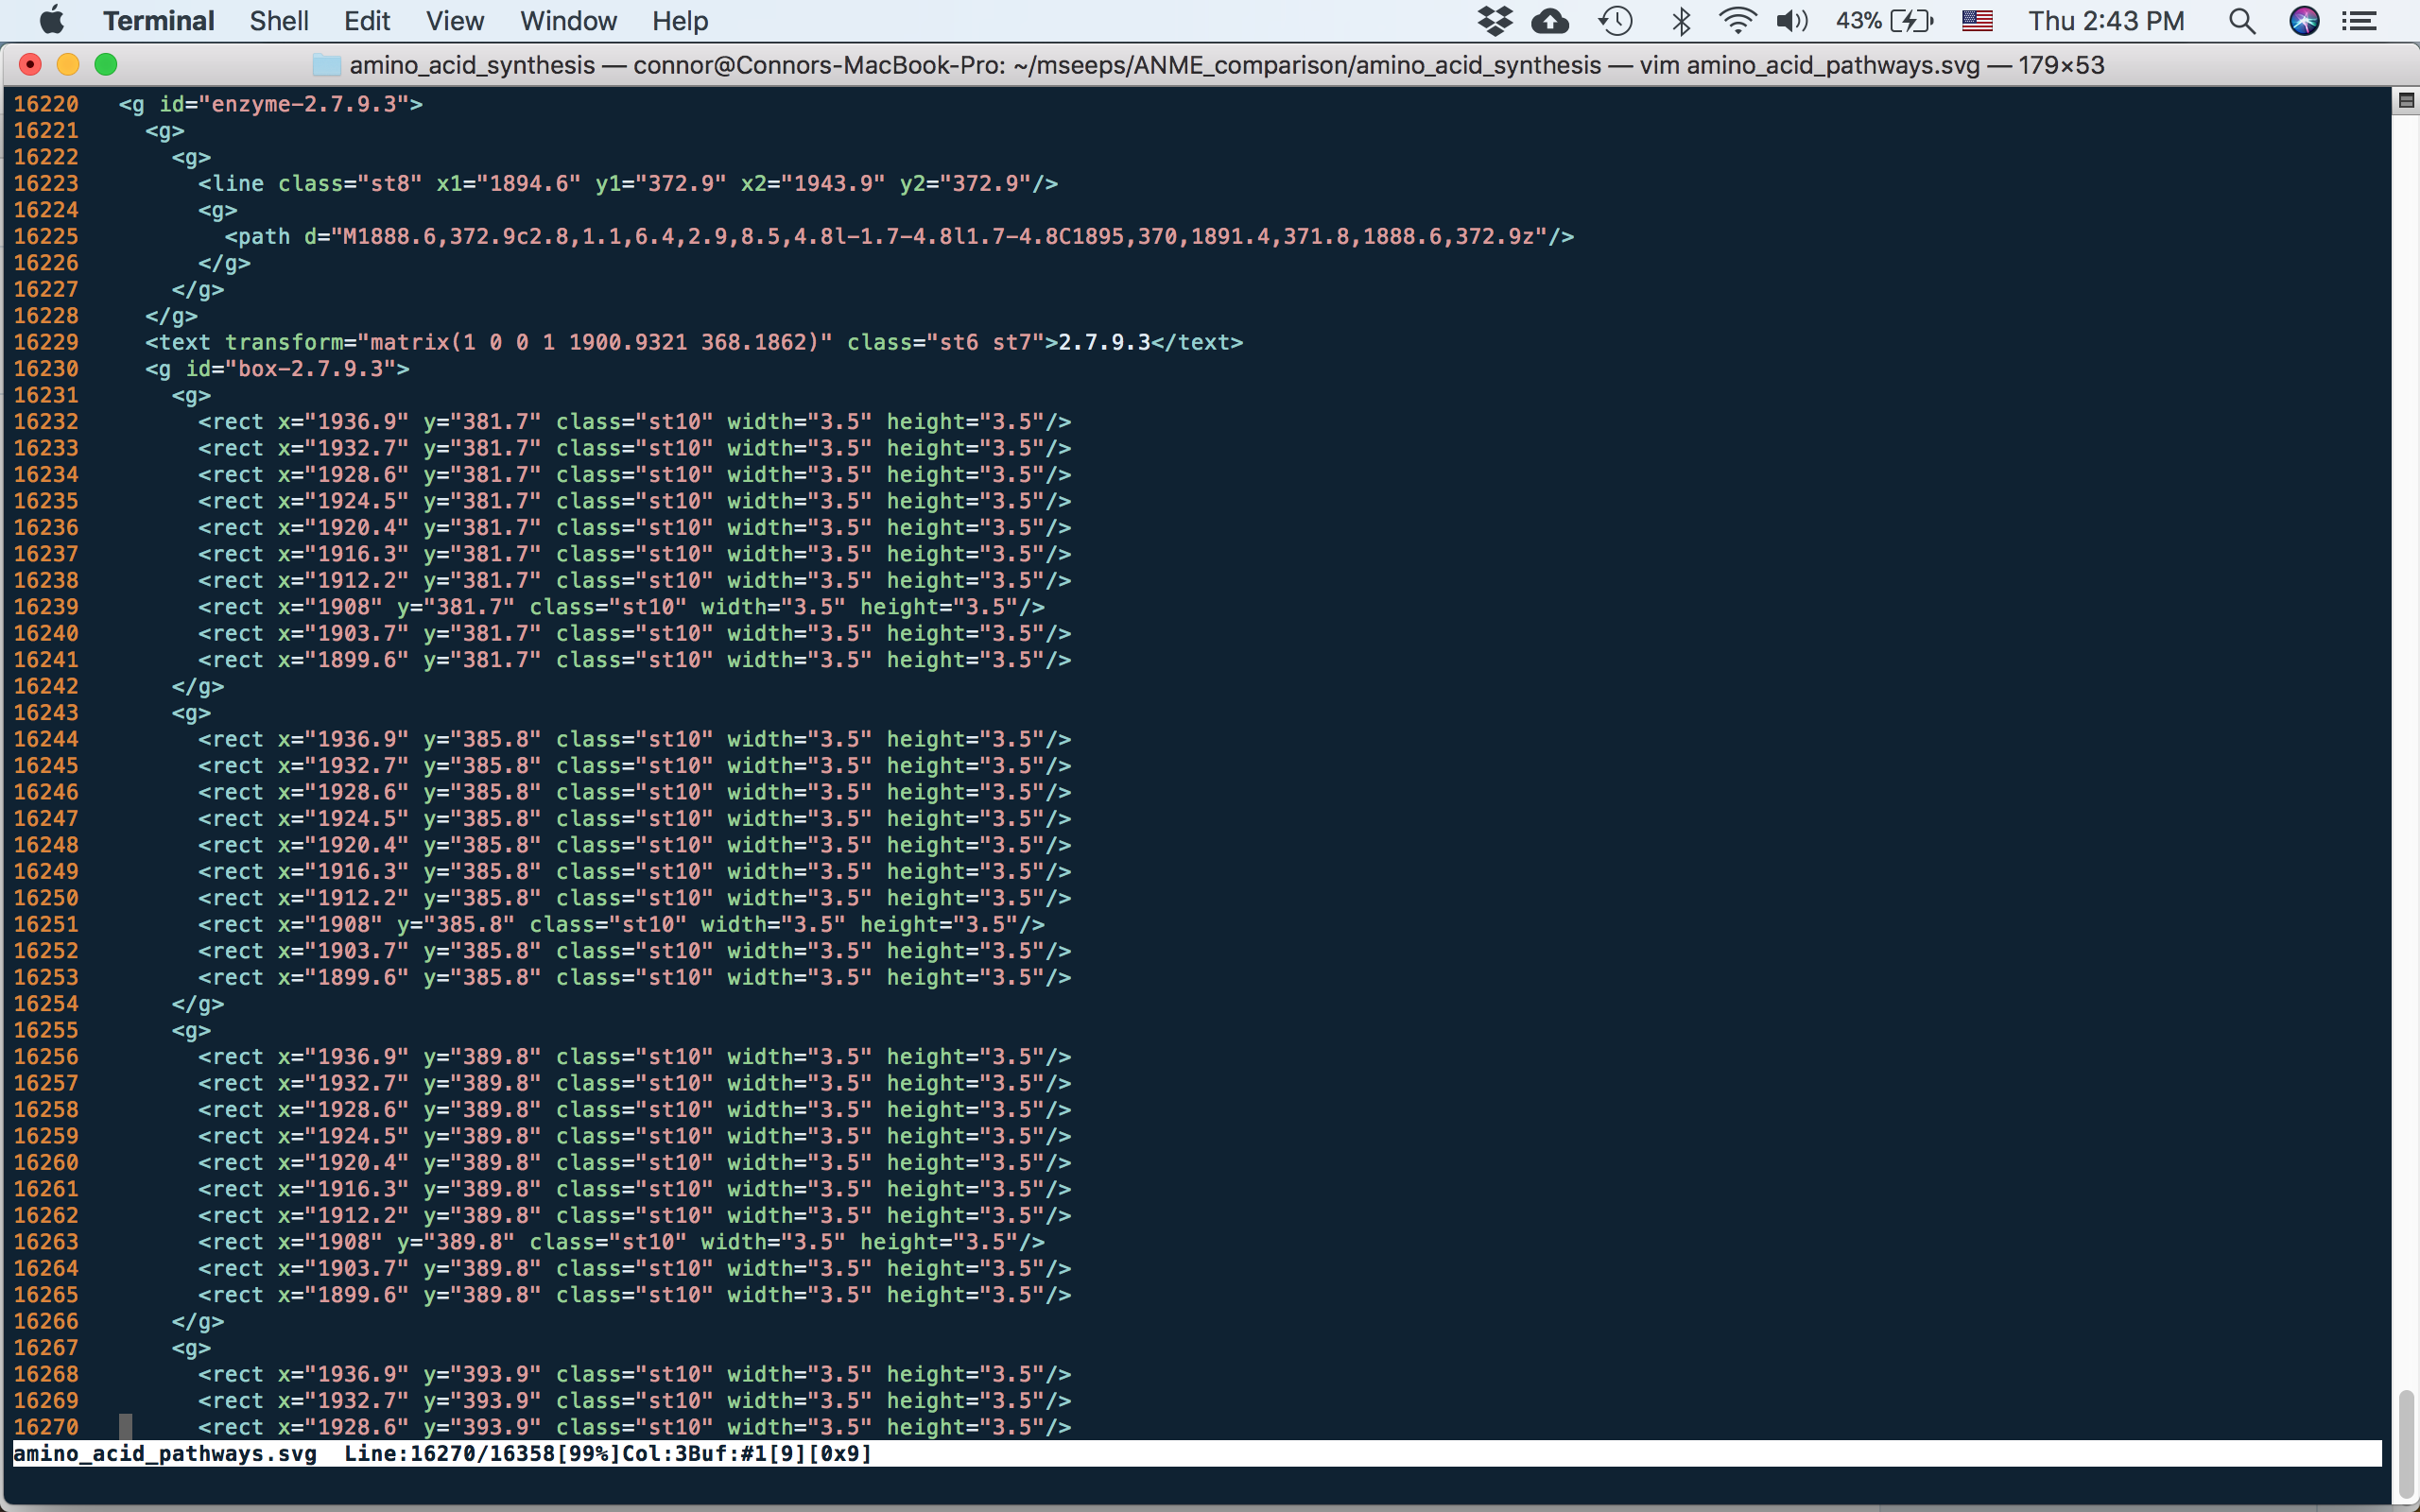
svg of part of one enzyme. the tag in svg is a group. You can see that the names for the whole enzyme and for the group of 100 boxes are retained from Illustrator
The names that were given to the groups in Illustrator have been retained in the svg file as the id tags, and it is this text that we’ll process using the script. The other thing to note is how the boxes are arranged, in this case as groups of 10 - these are the rows that were made originally.
Coloring the boxes programmatically
Now for the scripted part. You’ll need the code available here, which will color in the boxes based on a couple of text files. Run the script as follows: python color_template.py -e ec_numbers.csv -i template.svg -o colored.svg -c organism_colors.csv The ec_numbers.csv file must contain three columns and must have a header row labelled organism, ec, lineage. The organism column is the name of the organism, the ec column must contain the identifiers that match up to the names used in the svg file. For example, in the svg file, if there is a box called “box-1.1.1.1” then the corresponding annotation in the ec column should be 1.1.1.1. However, there isn’t a requirement that this column be EC numbers or even that they are all from the same source. You could combine EC numbers, KO numbers and Pfam families in this column they just have to match what’s written in the svg file. The lineage column should contain information on how to properly order all of the genomes into the 100 boxes. I use the full taxonomy string of the organism to allow for similar organisms to be grouped together. However, this column doesn’t require a taxonomy string and is simply used for lexicographic sorting, so you could put anything in there to sort organisms however you want. The organism_colors.csv file should contain two columns with a header row labelled organism and color. The organism column is the organism name that was used in the ec_numbers.csv file. The color column should contain a valid css color.