Exploratory data analysis with Pharo Smalltalk
The first time I heard about Smalltalk was reading through the wikipedia page for Ruby, which mentioned it as an influence. At the time I was just a few months into my transition from a wet-lab biologist into a bioinformatician and trying to decide between Perl, Python, and Ruby as a scripting language to learn. Python became my language of choice after a long battle with Perl (this was some years ago and Perl was much more relevant). I remember being really intrigued at Smalltalk’s syntax and it’s pure object-oriented approach; I was just starting to userstand what these concepts meant but was already gravitating to OOP. This was a language that seemed very alien to what I was picking up in C-derived scripting languages. I learned that you made a file with your program in it and then passed that file as an argument to another program to interpret it — that’s just how programming worked.
In contrast, instead of code existing in files that are run by an interpreter or compiled into a binary program, Smalltalk has the concept of image-based persistence, which encapsulates the current program state and all of the code into one. Editing your code is equivelent to changing the program itself rather than a static copy that gets turned into your program. This is a pretty wild concept and makes programming much more interactive. An example of how this might streamline your workflow is in debugging. Often programmers will use a debugger to step through the running code line by line to see how variable change and find the place where are bug happens. When the bug is found you then have to go to the line in the source and make the required change (and either run the program again or re-compile). But with Smalltalk you’re running “live” code so modifying it during debugging fixes it once. While I can appreciate this now as a more accomplished programmer, as a newbie I was utterly confused by it. I never picked it up Smalltalk.
Recently I was back on wikipedia looking at some other programming language’s page and again there was that smalltalk influence. So I scratched the itch and finally downloaded Pharo — which seems to be one of the more popular implementations — and tried out some basic data visualization.
Pharo is an integrated environment, there isn’t really separate source code for writing programs; they get written one method at a time in the IDE. But there is a playground feature that allows you to write short scripts and generally play around. The code snippets I show below are all taken from the playground.
First we need to install some external packages. Unlike python or R there doesn’t seem to be a single source of packages, instead repositories can be downloaded from URLs:
Metacello new
    baseline: 'Roassal3Exporters';
    repository: 'github://ObjectProfile/Roassal3Exporters';
    load.

Metacello new
  baseline: 'DataFrame';
  repository: 'github://PolyMathOrg/DataFrame/src';
  load.
Now let’s look at some penguin data! I’m using the palmerpenduins
dataset that was built
with R in mind. The DataFrame package can’t load from URLs directly but Pharo provides
some niffty built-in objects that allow us to convert the string URL into a ZnURL object,
which we can retrieve the contents of (i.e. download).
"Convert the url string to a Url object and download the contents, passing that into the
 data frame constructor.
"
df := DataFrame readFromCsv:
    'https://raw.githubusercontent.com/allisonhorst/palmerpenguins/master/inst/extdata/penguins_raw.csv' asUrl retrieveContents .
After that we can then set up the plot using the various Roassal classes. In the example
below I’m plotting the Culmen Length versus the Egg Date columns. It shows off a couple of
tricks I had to learn: first, was how to plot a date on the axis; and second, was how to
deal with NA values in the data frame.
chart := RSChart new.
lineaxes := RSScatterPlot new.

"Importing the CSV file doesn't recognize NA so convert them to NaN"
lineaxes x: ((df column: 'Date Egg') collect:
            [ :d | d julianDayNumber ])
         y: ((df column: 'Culmen Length (mm)') collect:
            [ :s | s = 'NA' ifTrue: ['NaN' asNumber]
                            ifFalse: [s asNumber] ]).

chart addPlot: lineaxes.
vticks := RSVerticalTick new.

"Offset controls the horizontal position"
chart ylabel: 'Culmen Length (mm)' offset: -20.

chart addDecoration: vticks.
hticks := RSHorizontalTick new.
hticks numberOfTicks: 8.
"Convert the julian day numbers back to Date objects. The asString message will
be sent during rendering to make it look pretty"
hticks labelConversion: [ :x | Date julianDayNumber: x]; useDiagonalLabel .

chart addDecoration:  hticks.
chart openOnce.
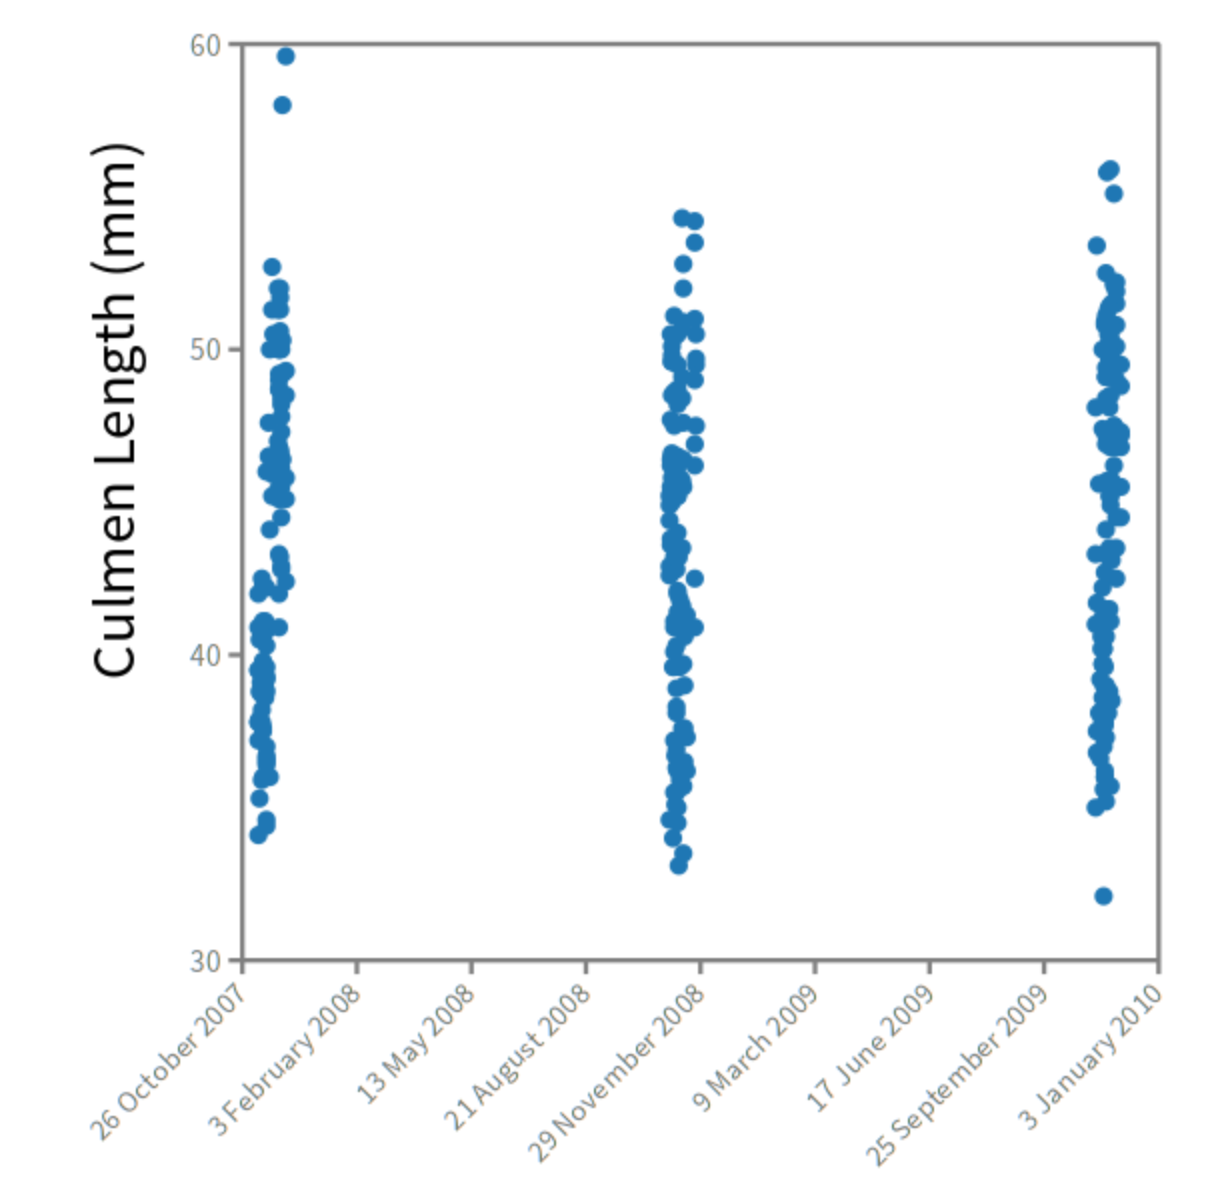
Basic plot of Penguins with the date as the X-axis
Next I wanted to try and replicate a Facet Grid one of the best features of seaborn and ggplot2 for plotting small multiples. I couldn’t find anything built in that would be the equivelent but Roassal has all of the primatives to make this happen. My solution below is based on the examples in the Roassal package:
"Create a canvas to add our charts to"
c := RSCanvas new.
"First find the unique values in the species column and then loop through the values"
groups := ((df column: 'Species') uniqueValues) collect: [ :species |

    "Subset the main dataset returning just the rows for the current species"
	spdf := df select: [:row | (row at: #Species) = species ].

    "Make a new group that will hold this chart"
	g := RSGroup new.
	chart := RSChart new.
	chart container: g.

    "Make a scatterplot"
    plot := RSScatterPlot new.

    "Get the x and y values the same as above"
	plot x: ((spdf column: 'Date Egg') asArray collect:
            [ :d | d julianDayNumber ])
         y: ((spdf column: 'Culmen Length (mm)') asArray collect:
            [ :s | s ifNil: ['NaN' asNumber]
                     ifNotNil: [s asNumber] ]).
	chart addPlot: plot.
	chart title: species.
	chart build.
    "The final statement of a block is returned... so here
     we are converting the group object, which holds the chart
     into a shape, which is needed to add onto the canvas
    "
	g asShape .
	].

c addAll: groups.

"Layout the three groups horizontally on the canvas"
RSHorizontalLineLayout on: c shapes.
c @ RSCanvasController.
c openOnce.
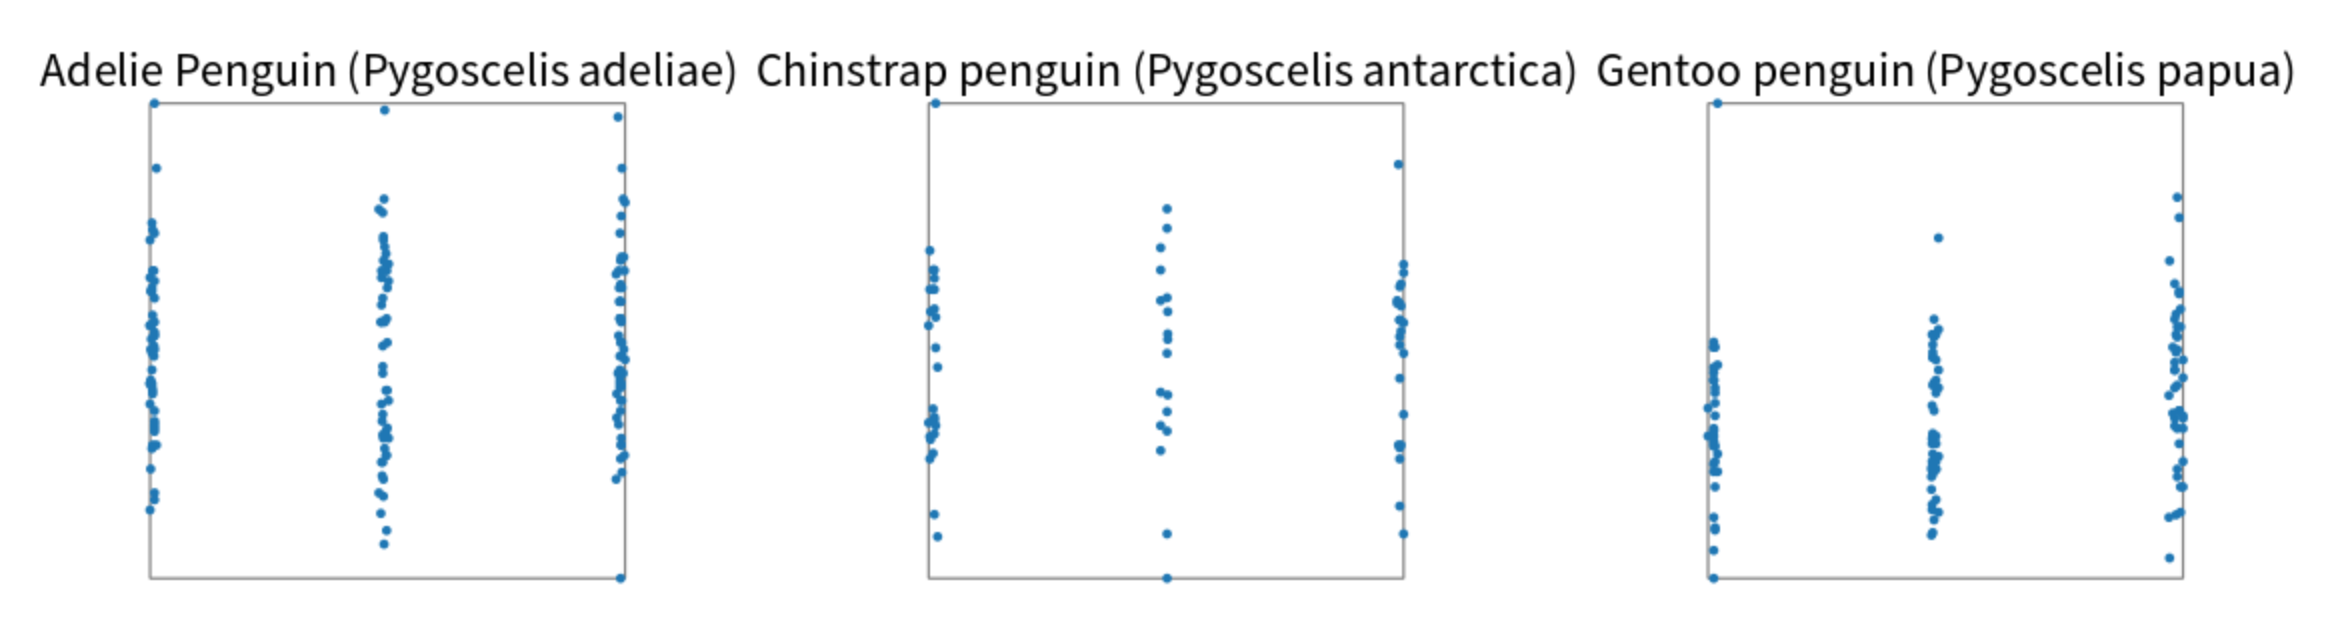
Split out the into three charts, one for each species
As you can tell from the code samples above there is a lot of boilerplate to set this up. Roassal isn’t a ggplot clone, it’s much more low level like base plotting in R or matplotlib. It’s still impressive the variety of things that you can accomplish with it, 2D charts are just one aspect of Roassal, which is probably why there is a bit more boiler plate than you might want for just making a chart.
There is also a bit of roughness to the DataFrame package. The type detection isn’t as smart as
in R so columns containing NA were being left as strings. I fixed this in my examples above wtih:
(df column: 'Culmen Length (mm)') collect:
            [ :s | s = 'NA' ifTrue: ['NaN' asNumber]
                            ifFalse: [s asNumber] ]
The collect method returns a new data series where each element has been transformed using the
code block as it’s argument. In this can I’m checking for NA and converting to NaN or the
real number. Similarily, dealing with a date axis involved manually transforming it into a
julian day representation (so basically just a number) and back again for the label. Despite this
I’ve come away with a pretty positive opinion of both these packages. The code in DataFrame is easy
to approach and I’ve already tried to add in a small fix
that improves the parsing of boolean types from CSV files. I also picked up a bug in the RSScatterPlot
class that was fixed by the developers almost instantly. It’s definitely a small community
but smalltalk makes it easy to investigate and patch bugs on the fly. It’s really quite cool
and lends itself to agile development.
I’m going to keep using Pharo on the side. For the moment I don’t think it could replace python/R in my professional work but the language is easy and good for quicker analyses.